The Coverage Data Model
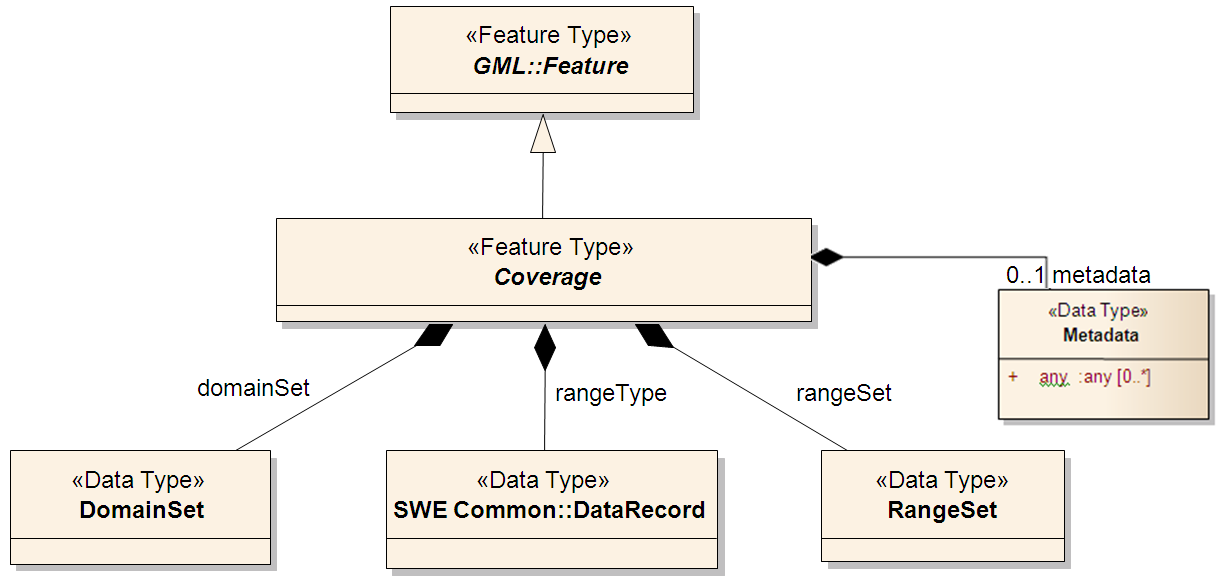
Abstractly, a coverage is a function mapping location (i.e., coordinates) to data values - in plain words: a coverage offers some value (such as a color pixel) for each of the coordinates it covers. These coordinates are called direct positions - only at those direct positions the coverage stores a value; via interpolation, values can also be generated for coordinates between direct positions - more about that later. To represent this, the coverage data structure technically consists of four main components (plus some details which we ignore at this level of detail):
- domain set: where can I find values?
- range set: the values.
- range type: what do the values mean?
- optional metadata: what else should I know about these data??
The UML diagram illustrates this structure; it shows the four components, of which metadata are optional, as well as the inheritance from the basic geo objecttype, Feature. Quit simple, isn't it?
Let us inspect these components in turn.
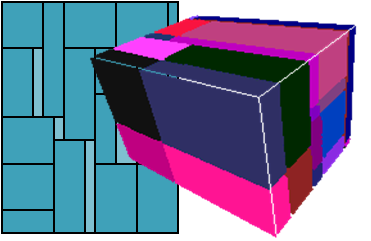
Domain set. The domain set consists of direct positions where values are located. As we focus on raster data / datacubes we only consider gid coverages where the domain set forms a (regular or irregular) grid. Such a grid, as well as its grid coordinates, can be of any number of dimensions (better said: axes), made up from spatial, temporal, and other axes such as spectral frequencies, for example. The underlying grid space of a domain set is defined by its corresponding Coordinate Reference System (CRS), more about that later.
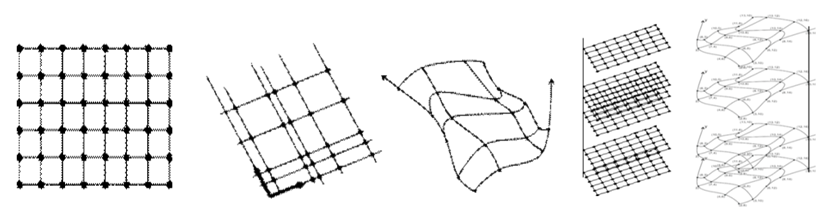
In gridded coverages, which is what we focus on with raster data and datacubes, coordinates are aligned on some grid, obviously.
Still, there is an amazing variety among possible grid types: Cartesian or geo-referenced, space or time or something else, regular or irregular, etc.
With growing complexity the description of a grid, as part of the domain set, grows, and likewise does the size of the corresponding domain set.
The simplest case is a regular Cartesian or geo-referenced axis; in this case, we simply need to store lower and upper bound as well as resolution.
In case of an irregular axis this is more involved: all the individual grid points on the axis between its lower and upper bound need to be stored explicitly.
More complex grids require even more involved representations.
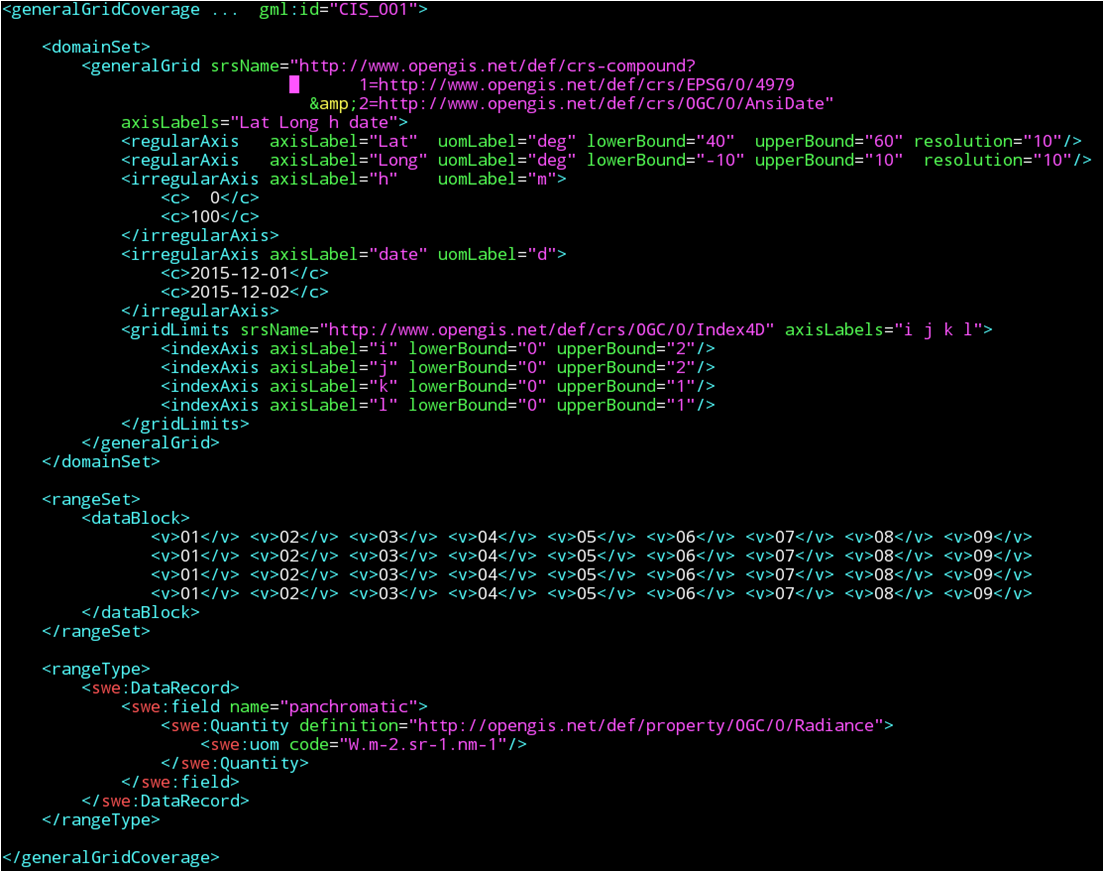
Below is an example for a grid, in XML representation, that involves both regular axes (Lat and Long) and an irregular one (time).
Note the definition of Lat and Long as regular axis with a given resolution,
as opposed to the explicit enumeration of the time steps in the date axis. The underlying (Cartesian) grid,
modelling the array data structure, is given by the GridLimits - but that is just a technical detail.
<DomainSet>
    <GeneralGrid srsName="[EPSG:4326],[OGC:AnsiDate]"
        axisLabels="Lat Long date" uomLabels="deg deg d">
        <RegularAxis   axisLabel="Lat"  uomLabel="deg" lowerBound="40"  upperBound="60" resolution="10"/>
        <RegularAxis   axisLabel="Long" uomLabel="deg" lowerBound="-10" upperBound="10"  resolution="10"/>
        <IrregularAxis axisLabel="date" uomLabel="d">
            <C>2015-12-01</C>
            <C>2015-12-02</C>
            <C>2016-00-12</C>
            <C>2016-05-01</C>
        </IrregularAxis>
        <GridLimits srsName="http://www.opengis.net/def/crs/OGC/0/Index3D" axisLabels="i j k">
            <IndexAxis axisLabel="i" lowerBound="0" upperBound="2"/>
            <IndexAxis axisLabel="j" lowerBound="0" upperBound="2"/>
            <IndexAxis axisLabel="k" lowerBound="0" upperBound="2"/>
        </GridLimits>
    </GeneralGrid>
</DomainSet>
Range values. For storage, these values will need to be linearized following one of many possible schemes, but this is an implementation detail of the particular format chosen and does not affect the fact that coordinates are determined by the coverage axes. There is also the question on how the direct positions of the domain set are connected to their respective values. Actually, there are several ways of achieving this:
- The domain set, together with a sequentialization rule which we ignore here, indicates a sequence of direct positions; the sequence in the range set follows this.
- Domain and range set are stored interleaved, as a sequence of coordinate/value pairs so that the correspondence is clear.
- Domain and range set are tiled, that is: partitioned into smaller parts. Inside each such tile any of the above techniques can be used.
- Sometimes the domain set is not explicitly available, but just some information to derive the underlying grid. A typical case is a sensor model which stores Ground Control Points out of which the sensor model generates the grid coordinates for the range values.
Range type. A coverage’s range type captures the semantics of the range set values; its definition is based on SWE (Sensor Web Enablement) Common so that sensor data can be transformed into coverages without information loss, thereby enabling seamless service chains from upstream data acquisition (e.g., through OGC SOS) to downstream analysis-ready user services (such as OGC WMS, WCS, and WCPS). Notably, the range type can go far beyond just a datatype indicator (such as integer versus float); unit of measure, accuracy, nil values, and the semantics (by way of a URL reference), and more information can be provided with a range type, thereby accurately describing the meaning of the values. The following is an example range type definition for panchromatic optical data, encoded in GML:
<swe:field name="panchromatic">
    <swe:Quantity definition="http://opengis.net/def/property/OGC/0/Radiance">
        <swe:description>panchromatic sensor</swe:description>
        <swe:NilValues>
            <swe:nilValue reason="http://www.opengis.net/def/nil/OGC/0/AboveDetectionRange">255</swe:nilValue>
        </swe:NilValues>
        <swe:uom code="W.m-2.sr-1.nm-1"/>
    </swe:Quantity>
</swe:field>
Metadata.
This optional part is left unspecified in the standard, it can contain any number of anything, literally (xs:any, for the XML experts).
In addition to domain set and range type, the mandatory technical metadata of a coverage, these are completely application dependent.
Of course, the coverage cannot understand them, but they will duly be transported so that the connection between data and metadata is preserved.
One example for such metadata is given by the European INSPIRE legal framework for a common Spatial Data Infrastructure.
INSPIRE prescribes canonical metadata for each object following a specific schema. Coverage metadata are the right place to keep those.
This demonstration showcases use of INSPIRE metadata.
Note the "any number": different applications may add their own metadata, and each application in practice would only look at those metadata it understands.
Here is an example where three different, independent metadata records coexist in the coverage; note how they all bring along their own schema:
<GeneralGridCoverage xmlns="http://www.opengis.net/cis/1.1/gml" ...>

    <DomainSet> ...  </DomainSet>
    <RangeSet> ...  </RangeSet>
    <RangeType> ...  </RangeType>
    <Metadata>
        <el-covmd:ElevationGridCoverageMetadata xmlns:el-covmd="http://inspire.ec.europa.eu/schemas/el-covmd/4.0" ...>
            ...
        </el-covmd:ElevationGridCoverageMetadata>
        <card4l:Card4lMetadata xmlns:card4l="..." ...>
            ...
        </card4l:Card4lMetadata>
        <special:MySpecialMetadata xmlns:special="..." ...>
            ...
        </special:MySpecialMetadata>

    </Metadata>

</GeneralGridCoverage>
Coordinates and Grids
Let's come back to CRSs and the cumbersome srsName attribute we skipped explaining in the above domain set example.
Science tells us that a coordinate is meaningless as long as there is no indication about the reference system in which it is expressed.
A value of 42 - is that degrees (referring to what datum?), meters, years since epoch, or million years backwards?
All of that information is provided by the CRS.
As per OGC Naming Authority decision, CRSs shall be expressed in URLs, and that is what we find in the srsName attribute
(which, BTW, expands to spatial reference system name - some legacy terminology stemming from GML).
These URLs you can indeed resolve by simply following
http://www.opengis.net/def/crs/EPSG/0/4326 or
http://www.opengis.net/def/crs/OGC/0/AnsiDate;
a so-called CRS resolver service, running an open-source implementation by Jacobs University, does that trick.
Being annoyed about the complexity, CIS 1.1 allows any commonly accepted notation, including notations like EPSG:4326.
So far, so good - but we need multi-dimensional CRSs. The EPSG catalog is large, but preparing all possible axis combinations is just unfeasible.
Therefore, and foillowing ISO 19111-2, CRS and axis composition is provided where the base URL ends with crs-compound,
followed by an ordered list of component CRSs and axis. And that is exactly what our funny srsName does - slightly reformatted it becomes clear:
http://www.opengis.net/def/crs-compound?
    1=http://www.opengis.net/def/crs/EPSG/0/4326
  & 2=http://www.opengis.net/def/crs/OGC/0/AnsiDate
This completes the information necessary to understand a domain set. But here is some more service:
it would slow down services considerable if, for each coverage decoding, it first needs to retrieve the CRS definition.
Actually, not all of it is needed anyway - most important are the axis names and units of measure.
The axisLabels="Lat Long date" and uomLabels="deg deg d" attributes provide this excerpt directly, for the tool's convenience.
Additionally, the axis labels define the sequence of axes;
this axis sequence ambiguity actually is a problem recurring in GeoJSON and other OGC services where it is just implicitly assumed.
Format encodings
The coverage structure is represented 1:1 in the XML, JSON, and RDF encodings coming with CIS 1.1. However, while these encodings are "informationally complete" in that they carry all of a coverage's information they are not always inefficient. For 1-D diagrams formats like JSON are ideal because the file will be small anyway, and can be consumed conveniently by some JavaScript or TypeScript client and its diagramming libraries. A satellite scene, on the other hand, nobody would want to store and exchange in one monolithic XML file.
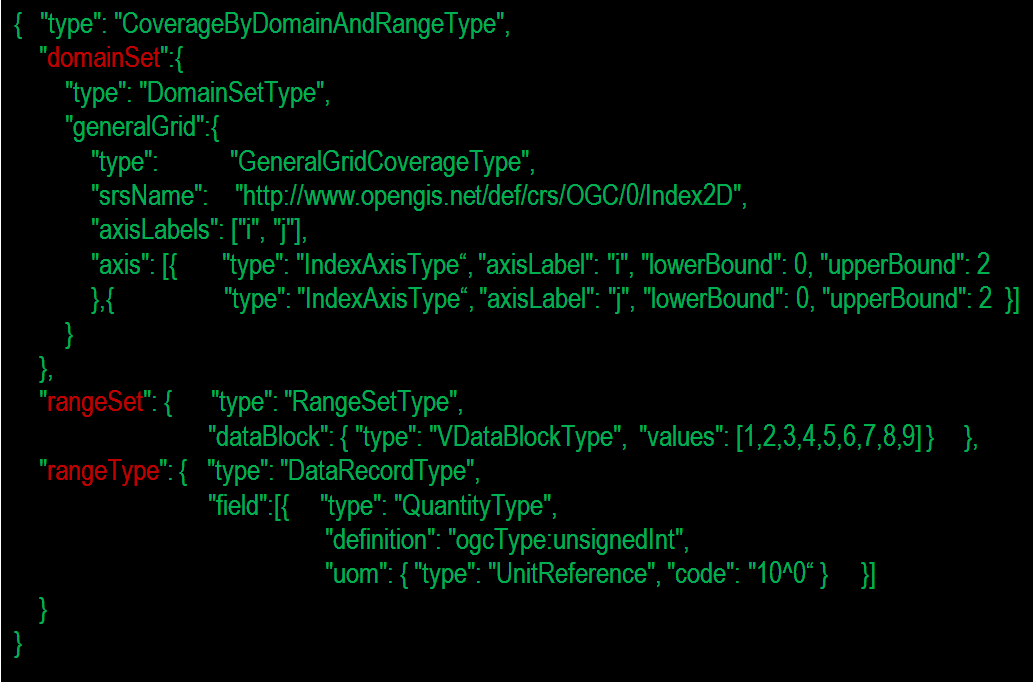
(click on image to enlarge)
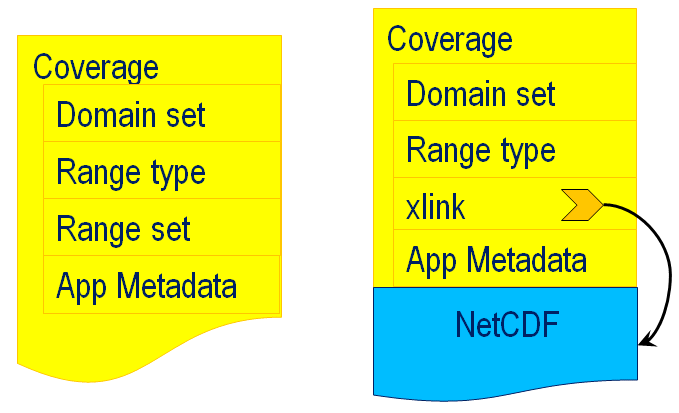
Therefore, binary formats are supported for coverage encoding in addition. A lineup of widely used binary formats is available in CIS extensions, including GeoTIFF, NetCDF, GRIB2, JPEG2000, and several more. Of course, it is well known that these formats have their individual ways of representing "metadata" that could carry domain set, range type, and coverage metadata. Actually, often one or the other component cannot be transported at all - think of JPEG, for example. Well, often this is ok, and if a user explicitly requests such a format they will know hwat they do. Citing the JPEG example again, if the coverage should just be portrayed on a screen it is perfectly acceptable to miss part of the data.
But as always in life, we want it all: informationally complete and, at the same time, efficient. For this purpose a container concept has been introduced with CIS 1.0 and extended with CIS 1.1. A coverage container consists of a "shell" that may use any suitable format that can hold files inside, such as Multipart/MIME, zip, SAFE, etc. Inside there is a canonical header in some information-lossless format, like the abovementioned XML, JSON, or RDF, followed by one or more files which typically would contain some efficient binary encoding of the range set (but could also be metadata or domain set, for that matter). The header holds the coverage data in general, but for the "outsourced" parts instead of the data stores a refernce to the file(s) coming. By the way, this mechanism can also be used to encode tiled coverages.
In summary, the common, unified structure of a coverage can be encoded in a variety of alternativees, with individual pros and cons, with options for all situations arising.
Standardization Status
CIS normatively relies on the concepts and terminology of ISO 19123-1/OGC AT6.1 (primer).
The latest version of CIS is CIS 1.2, adopted as ISO 19123-2 and currently under adoption by OGC. This version re-unites the different coverage types which, for historical reasons, were distributed over separate standards: CIS 1.0 with its Rectified Grid Coverages, the ReferenceableGridCoverage extension, and the modern, integrated grid / datacube structure, General Grid Coverage, introduced with CIS 1.1. Once adoption is finished by OGC (expected for Fall 2026), CIS 1.1 will constitute the one-stop shop for coverage data modeling.
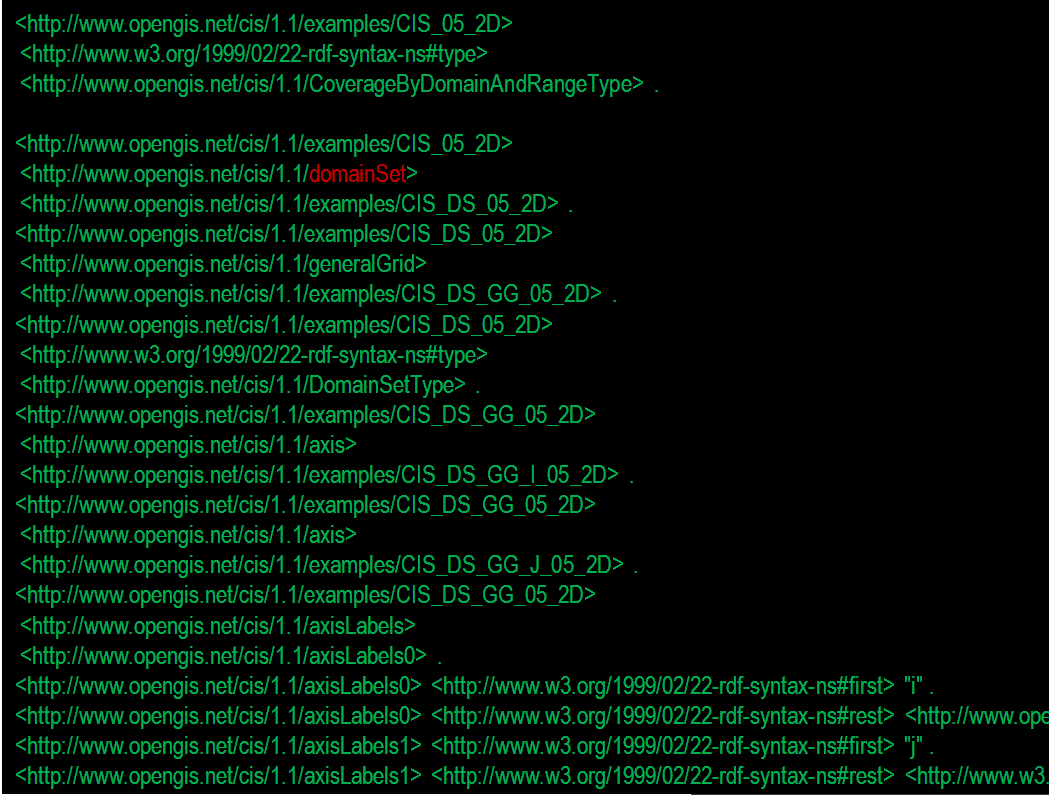
In terms of encodings, CIS offers XML, JSON, and RDF since CIS 1.0. With CIS 1.1, a modernized JSON schema is introduced in addition to the existing one. All encodings come with ample example files illustrating the mapping.
Questions? Answers!
We gladly share our experience to answer any questions you may have, from strategic issues down to any technical depth. This can be discussed based on your own data, your own ecosystem requirements, and of course under strict confidentiality (such as under an NDA). Webinars as well as on-site meetings are possible.
Contact us - we gladly share our experience and insight from 20+ years of writing, implementing, and testing OGC, ISO, and INSPIRE standards, implementing them from Raspberry Pi to dozens-of-Petabytes archives.
High-Performance Datacube Engine:
rasdaman
The open-source pioneer datacube engine, rasdaman is OGC Coverages reference implementation.
The rasdaman engine has pioneered Actionable Datacubes® and Array Databases. With its enabling approach of a high-level datacube analytics language -- adopted into ISO SQL -- and underpinned by a powerful datacube architecture with federation, distributed data fusion, AI, highly effective query optimization, and more -- rasdaman remains the gold standard for modern multi-dimensional raster data services, being up to 74x faster than other engines.